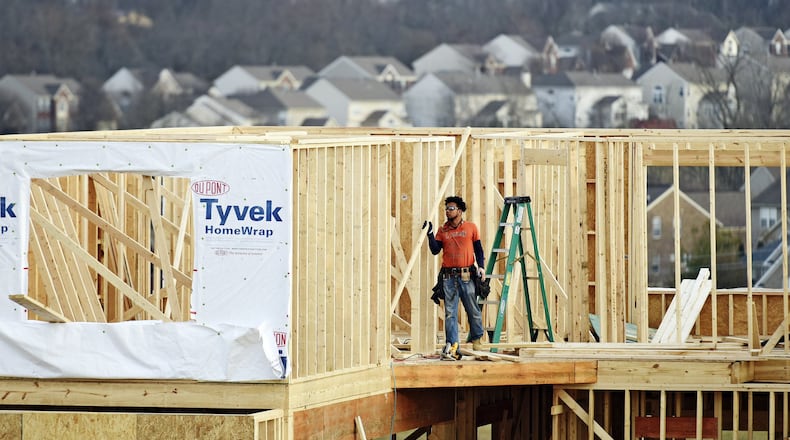
Butler County saw a total of 649 single-family permits in 2017 compared to 652 the previous year, a 0.5 percent dip, while Warren County jumped with a total of 1,304 single-family permits in 2017 compared to 1,050 the year before, a 24.2 percent increase.
MORE POPULAR NEWS
MUST SEE: How Butler County amusement parks look in archive photos
This new restaurant spent nearly a year renovating a former Bob Evans, and it will open soon
Both are led by communities that continue to see surging growth, Warren County by Hamilton Twp. (291 permits for 2017) and Butler County by Liberty Twp. (271 permits for 2017).
Dan Dressman, executive director of the Home Builders Association of Greater Cincinnati, said Butler and Warren counties are on a similar trajectory as far as new home permits are concerned.
“The number of new residential households will continue to expand over the next few years,” Dressman said. “Both have also seen considerable new job growth, which drives new home sales.”
Although Warren County has outpaced Butler County over the last couple of years it’s still ripe for both commercial and residential growth due to available undeveloped land, interstate accessibility and overall positive business climate, Dressman said. School districts such as Lakota and Mason are also contributing factors to the popularity of new home construction in both counties.
So where is each county headed for new home construction growth this year? Dressman said new residential development sites are on the books and on the ground in both counties in anticipation of continued growth.
Home sales in both Butler and Warren counties experienced similar small dips in 2017, with Butler County seeing a 2.4 percent drop in the amount of home sales and Warren County seeing a 2.2 percent decline.
However, both counties saw gains in home sale prices, with Butler County increasing 6.25 percent and Warren County increasing 7.2 percent.
Donna Deaton, vice president and manager of RE/MAX Victory in West Chester Twp., said the both counties are similar in terms of low inventory and the amount of days a home remains on the market before it sells. Butler County, however, tends to have more sales as the population is larger and homes are a little more affordable, she said.
That’s a fact borne out in statistics heading into 2018: Warren County has had 363 sales since Jan. 1, while Butler County is already at 588, not including For-Sale-By-Owner transactions, Deaton said.
As for differences, Warren County’s values tend to be higher and properties for sale, especially those priced at $350,000 and under, receive multiple offers and can go as high as $20,000 over list price, she said.
The communities of Mason and Deerfield Twp. seem to be the most sought-after locations, she said. According to the State of Ohio School report card, some Warren County schools have better scores, Deaton said.
“I think that weighs heavily on a parent’s decision on where to purchase if the affordability is there,” she said. “However, homes in Butler County, especially communities near the major highways, are sought after as well as they can be more affordable and you can sometimes get a larger home vs the same square footage to those in Warren County, depending on the area of course.”
Both counties will continue to see low inventory for the near future, Deaton said.
“As long as we have low inventory, we’ll have less days on market and values will increase,” she said. “Both counties will (see) growth in new construction to meet the demand for housing.”
About the Author

