DETAILS: State remediation rate drops; some doubt the data
The report also shows a remediation rate for each high school in the state that had at least six students enroll at an Ohio public college. These rates are not a clear proxy for a high school’s academic performance, as they don’t measure the academics of students who attend private colleges, out-of-state colleges or no college.
This list examines only students who attended Ohio public colleges and universities as freshmen in 2018-19. It shows what percentage of freshmen from each high school took remedial (developmental) math or English.
College “remediation rate” for Dayton-area schools
67% — Horizon Science Academy
56% — Middletown Christian
41% — Meadowdale HS, Northridge HS
40% — Ohio Virtual Academy
39% — Trotwood-Madison HS
2018 STORY: Math ACT scores in U.S. lowest in 20 years
38% — Preble Shawnee HS
36% — Fairborn HS
33% — Dayton Business Tech HS
32% — Stivers HS, Ponitz CTC
31% — Belmont HS, DECA
30% — National Trail HS
29% — Ohio Connections Academy
28% — Dunbar HS, Wayne HS, Twin Valley South HS
27% — West Carrollton HS
26% — Northmont HS, Chaminade Julienne HS
25% — Piqua HS
24% — Thurgood Marshall HS
RELATED: Photos, bios of local schools’ 2019 valedictorians
22% — Tri-County North HS
21% — Stebbins HS
20% — Troy HS, East Dayton Christian
19% — Butler HS, Miamisburg HS, Franklin HS, Waynesville HS
18% — Xenia HS, Greeneview HS
17% — Miami East HS, Newton HS
16% — Beavercreek HS, Lebanon HS, Milton-Union HS, Yellow Springs HS
14% — Fairmont HS, Centerville HS, Bellbrook HS, Bethel HS
13% — Brookville HS, Tippecanoe HS, Alter HS, Dayton Christian
12% — Dayton Regional STEM School, Fenwick HS
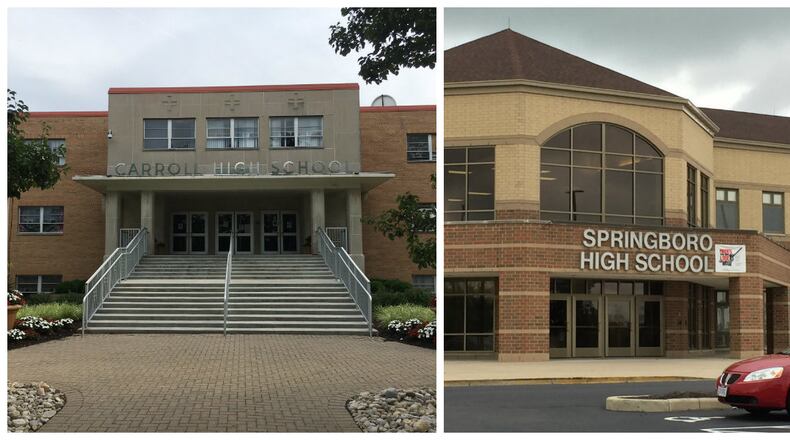
11% — Carroll HS, Valley View HS, Eaton HS
10% — Xenia Christian
9% — Carlisle HS
8% — Springboro HS, Spring Valley Academy
7% — Covington HS
5% — Oakwood HS
4% — Dixie HS, Troy Christian
0% — Cedarville HS, Miami Valley School
******************
How many students were counted?
For context, here is the raw number of first-time freshmen attending Ohio public colleges and universities as freshmen in 2018-19:
394 — Centerville HS
358 — Beavercreek HS
290 — Springboro HS
283 — Fairmont HS
208 — Miamisburg HS
202 — Lebanon HS
194 — Wayne HS
183 — Northmont HS
149 — Ohio Virtual Academy
136 — Troy HS
126 — Stebbins HS
125 — Bellbrook HS
112 — Butler HS
107 — Tippecanoe HS
104 — Carroll HS
99 — Oakwood HS
89 — West Carrollton HS
87 — Ponitz CTC
85 — Piqua HS
83 — Ohio Connections Academy
82 — Xenia HS
78 — Fairborn HS
76 — Valley View HS
74 — Franklin HS
73 — Chaminade Julienne HS
66 — Trotwood-Madison HS
63 — Alter HS
60 — Stivers HS
58 — Waynesville HS
50 — Dayton Regional STEM School
50 — Fenwick HS
48 — Brookville HS
42 — Bethel HS
39 — Greeneview HS
38 — Milton-Union HS
37 — Eaton HS
35 — Miami East HS
35 — Carlisle HS
35 — DECA
32 — Belmont HS
29 — Preble Shawnee HS
29 — Dunbar HS
28 — Dixie HS
27 — Covington HS
27 — Yellow Springs HS
25 — Twin Valley South HS
25 — Thurgood Marshall HS
24 — Dayton Christian
23 — Newton HS
23 — Troy Christian
23 — Tri-County North HS
22 — Northridge HS
21 — Horizon Science Academy
17 — Meadowdale HS
16 — Miami Valley School
12 — Cedarville HS
12 — Spring Valley Academy
10 — Xenia Christian
10 — East Dayton Christian
10 — National Trail HS
9 — Dayton Business Tech HS
9 — Middletown Christian
About the Author

